1.5.1 Creating Row Vectors
There are several ways to create row vector variables. The most direct way is to put the values that you want
in the vector in square brackets, separated by either spaces or commas.
>> v = [1 2 3 4]
v =
1 2 3 4
1.5.2 Creating Column Vectors
One way to create a column vector is by explicitly putting values in square brackets, separated by semicolons:
>> c = [1; 2; 3; 4]
c =
1
2
3
4
1.5.2 Creating Matrix Variables
Creating a matrix variable is really just a generalization of creating row and column vector variables.
The matrix variable mat is created by explicitly typing the values.
>> mat = [4 3 1; 2 5 6]
mat =
4 3 1
2 5 6
These core data structures are built in to F#, well the F# Powerpack.
So you can find the F# powerpack at codeplex. Once you download it you can easily open up a script file
and start creating your own vectors and matrices.
#r @"C:\Program Files (x86)\FSharpPowerPack-1.9.9.9\bin\FSharp.PowerPack.dll"
open Microsoft.FSharp.Math
Creating Row Vectors (in F#)
let rowvector = [1.0; 2.0; 3.0; 4.0]
Creating Column Vectors (in F#)
let onecolumnvector = Matrix.ofList [[1.0];[2.0];[3.0];[4.0]]
Creating a Matrix (in F#)
let matrix = Matrix.ofList [[4.0;3.0;1.0]; [2.0;5.0;6.0]]
let rowvector = [1.0; 2.0; 3.0; 4.0]
Creating Column Vectors (in F#)
let onecolumnvector = Matrix.ofList [[1.0];[2.0];[3.0];[4.0]]
Creating a Matrix (in F#)
let matrix = Matrix.ofList [[4.0;3.0;1.0]; [2.0;5.0;6.0]]
With the simple stuff out of the way I wanted to go a little deeper... so on to chapter 2 (Graphical Displays).
Now that we know how to create the data let's do something interesting with it... e.g. visualize it!
One way to visualize the data is to display it on a standard 2D chart with X and Y coordinates. In MATLAB you'd typically use the "built in" Plot function which (by definition thus far) can plot a single x,y coordinate or optionally two vectors of coordinates representing x and y. So in MATLAB will create a couple of vectors representing x and y. To do this we lay down the following expression :
>> x = 1:6;
>> y = [1 5 3 9 11 8]
The x vector above may look a little strange but basically what were doing is creating a vector from 1 to 6 with a step of 1. So the x and y column vectors above would look like this in the MATLAB command window.
x , y
(1 , 1)
(2, 5)
(3, 3)
(4, 9)
(5, 11)
(6, 8)
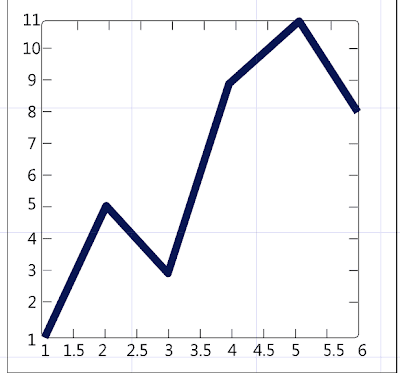
Finally, we'd plot the vectors with the following expression :
>> plot (x , y)
It's worth noting that under the covers MATLAB is actually creating a 2D chart, plotting all the points or coordinates in both vectors, and then displays the 2D chart in a new window.
Here is the following MATLAB output.
Now that we know how to create the data let's do something interesting with it... e.g. visualize it!
One way to visualize the data is to display it on a standard 2D chart with X and Y coordinates. In MATLAB you'd typically use the "built in" Plot function which (by definition thus far) can plot a single x,y coordinate or optionally two vectors of coordinates representing x and y. So in MATLAB will create a couple of vectors representing x and y. To do this we lay down the following expression :
>> x = 1:6;
>> y = [1 5 3 9 11 8]
The x vector above may look a little strange but basically what were doing is creating a vector from 1 to 6 with a step of 1. So the x and y column vectors above would look like this in the MATLAB command window.
x , y
(1 , 1)
(2, 5)
(3, 3)
(4, 9)
(5, 11)
(6, 8)
Finally, we'd plot the vectors with the following expression :
>> plot (x , y)
It's worth noting that under the covers MATLAB is actually creating a 2D chart, plotting all the points or coordinates in both vectors, and then displays the 2D chart in a new window.
Here is the following MATLAB output.
Not to shabby, of course we could accomplish the same thing in .NET using F# and WPF.
So I thought about it and decided I did not want to write my own charting component just for the
blog post series. Especially since I've had the first build (and free release) of Visifire for WPF & Silverlight still laying around on my hard drive. :-)
So with the decision made to leverage visifire I produced the following F# code below :
#r @"C:\\Users\\cfrederick\\Documents\\Visual Studio 2010\\Projects\\MATLAB Discoveries\\lib\\visifire\\WPFVisifire.Charts.dll"
#r @"C:\\Program Files (x86)\\Reference Assemblies\\Microsoft\\Framework\\v3.0\\PresentationFramework.dll"
#r @"C:\\Program Files (x86)\\Reference Assemblies\\Microsoft\\Framework\\v3.0\\WindowsBase.dll"
#r @"C:\\Program Files (x86)\\Reference Assemblies\\Microsoft\\Framework\\v3.0\\PresentationCore.dll"
open System(*Charting references*) open Visifire.Charts open System.Windows open System.Windows.Controls
//Plot function, used to plot a single data pointlet plot x y = let dp = new DataPoint() dp.XValue <- x dp.YValue <- y dp
let createChart xs ys =
  let chart = new Chart()
  let title = new Title()
  title.Text <- "MATLAB Sample Plotting Chart"
  chart.Titles.Add title
  chart.Watermark <- false

  let data =
   let dataseries = new DataSeries()
   dataseries.RenderAs <- RenderAs.Line
    List.zip xs ys
     |> List.map(fun (x,y) -> plot x y)
     |> List.iter(fun dp -> dataseries.DataPoints.Add dp)
    dataseries
    chart.Series.Add data
   chart
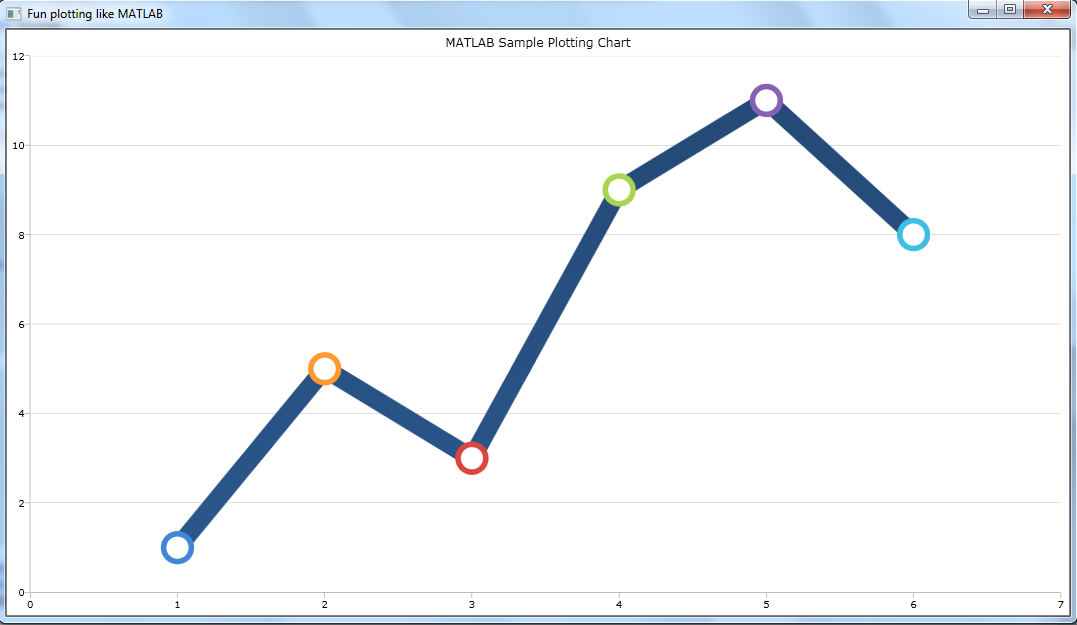
let content = createChart [1.0..6.0] [1.0;5.0;3.0;9.0;11.0;8.0] let window = new Window(Title = "Fun plotting like MATLAB", Content = content)
[] ignore <| (new Application()).Run window
And here is the final output from FSI and VS2010.
No comments:
Post a Comment